Back
Read all

Sports venue & match-booking app for North East India → pan-India expansion
Figma, Notion


Challenges
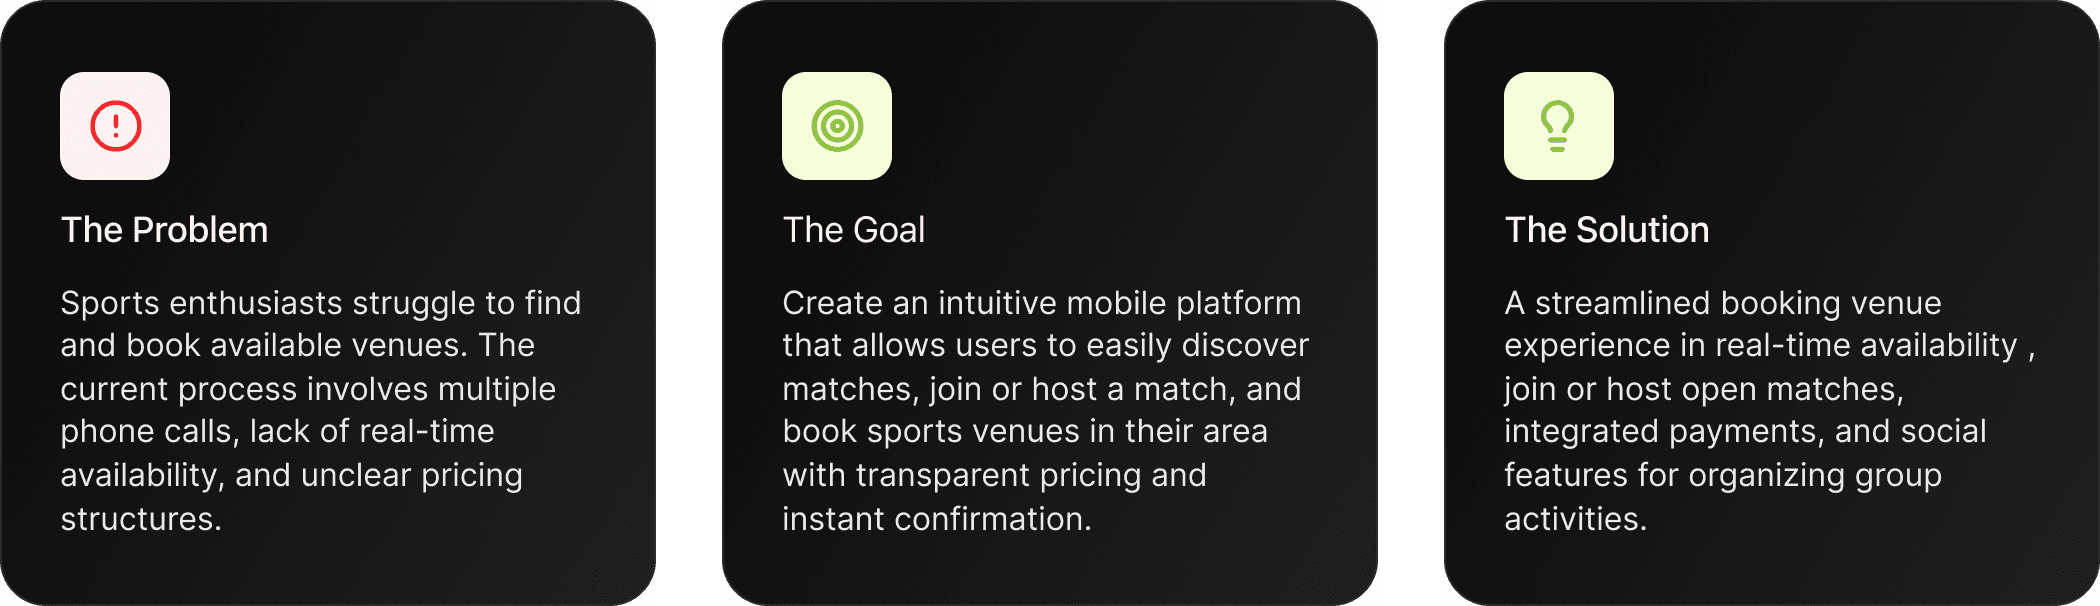
How might we make sports venue booking more accessible and efficient for casual players and organizers?
Research Methodology
Primary: Semi-structured interviews (players/organisers), on-site observations at turfs, short intercept surveys
Secondary: Market scan, app reviews, social/group analysis
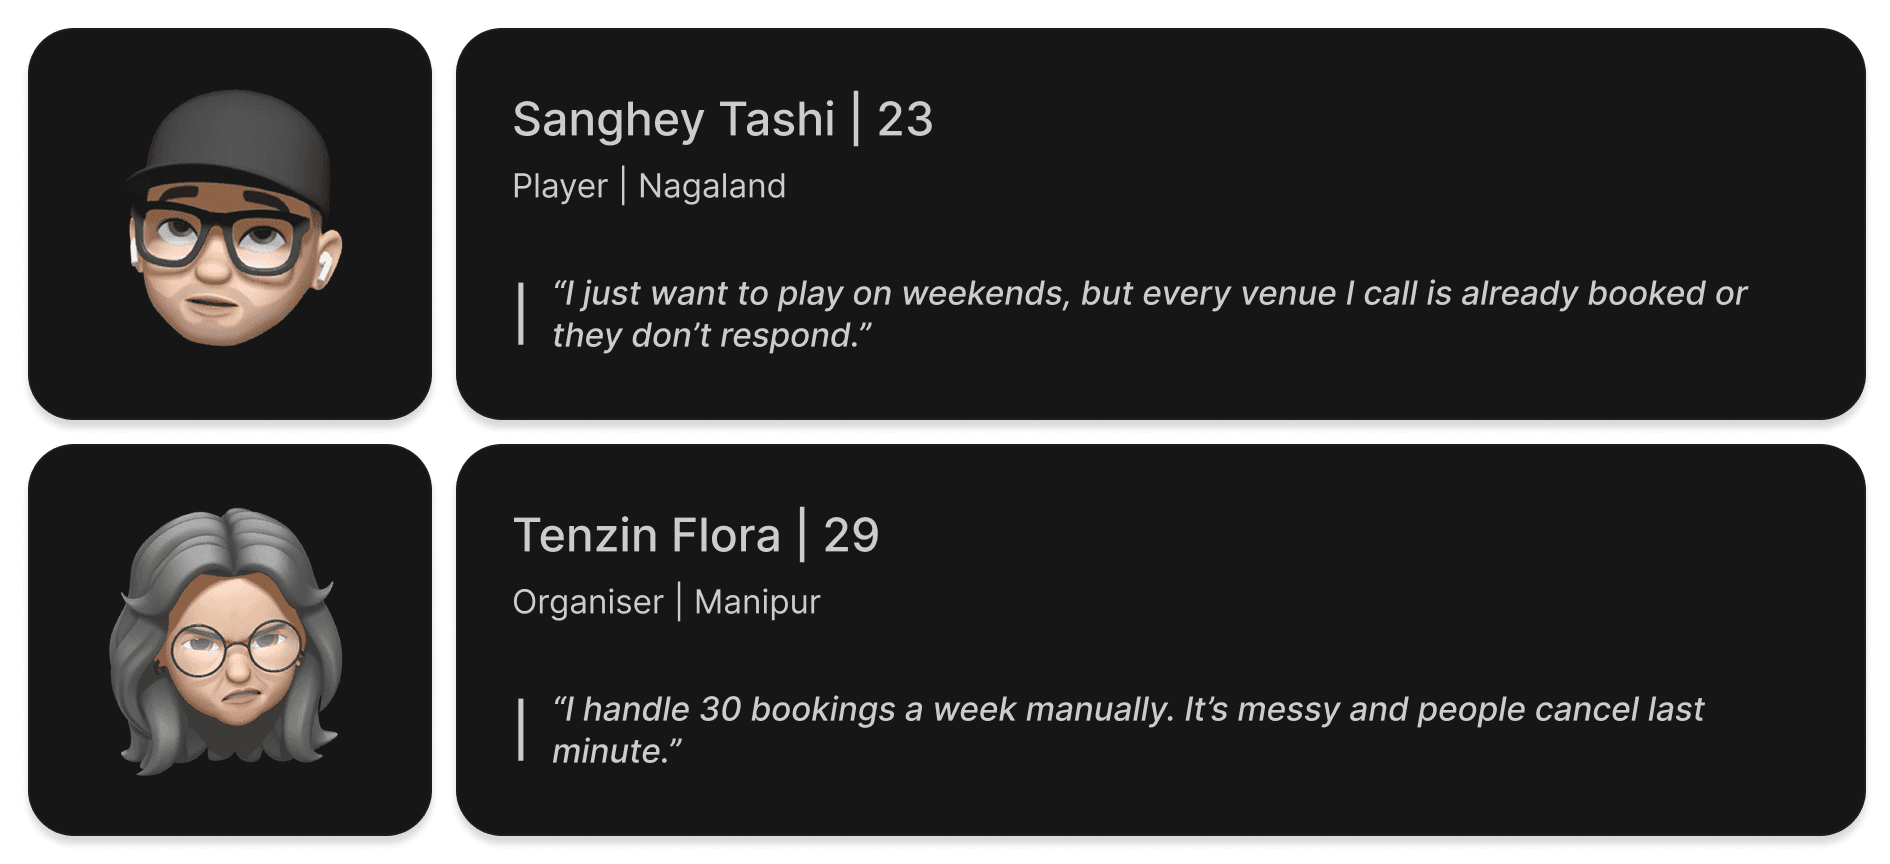
User Persona
Defining our core users to align product decisions with real-world needs.
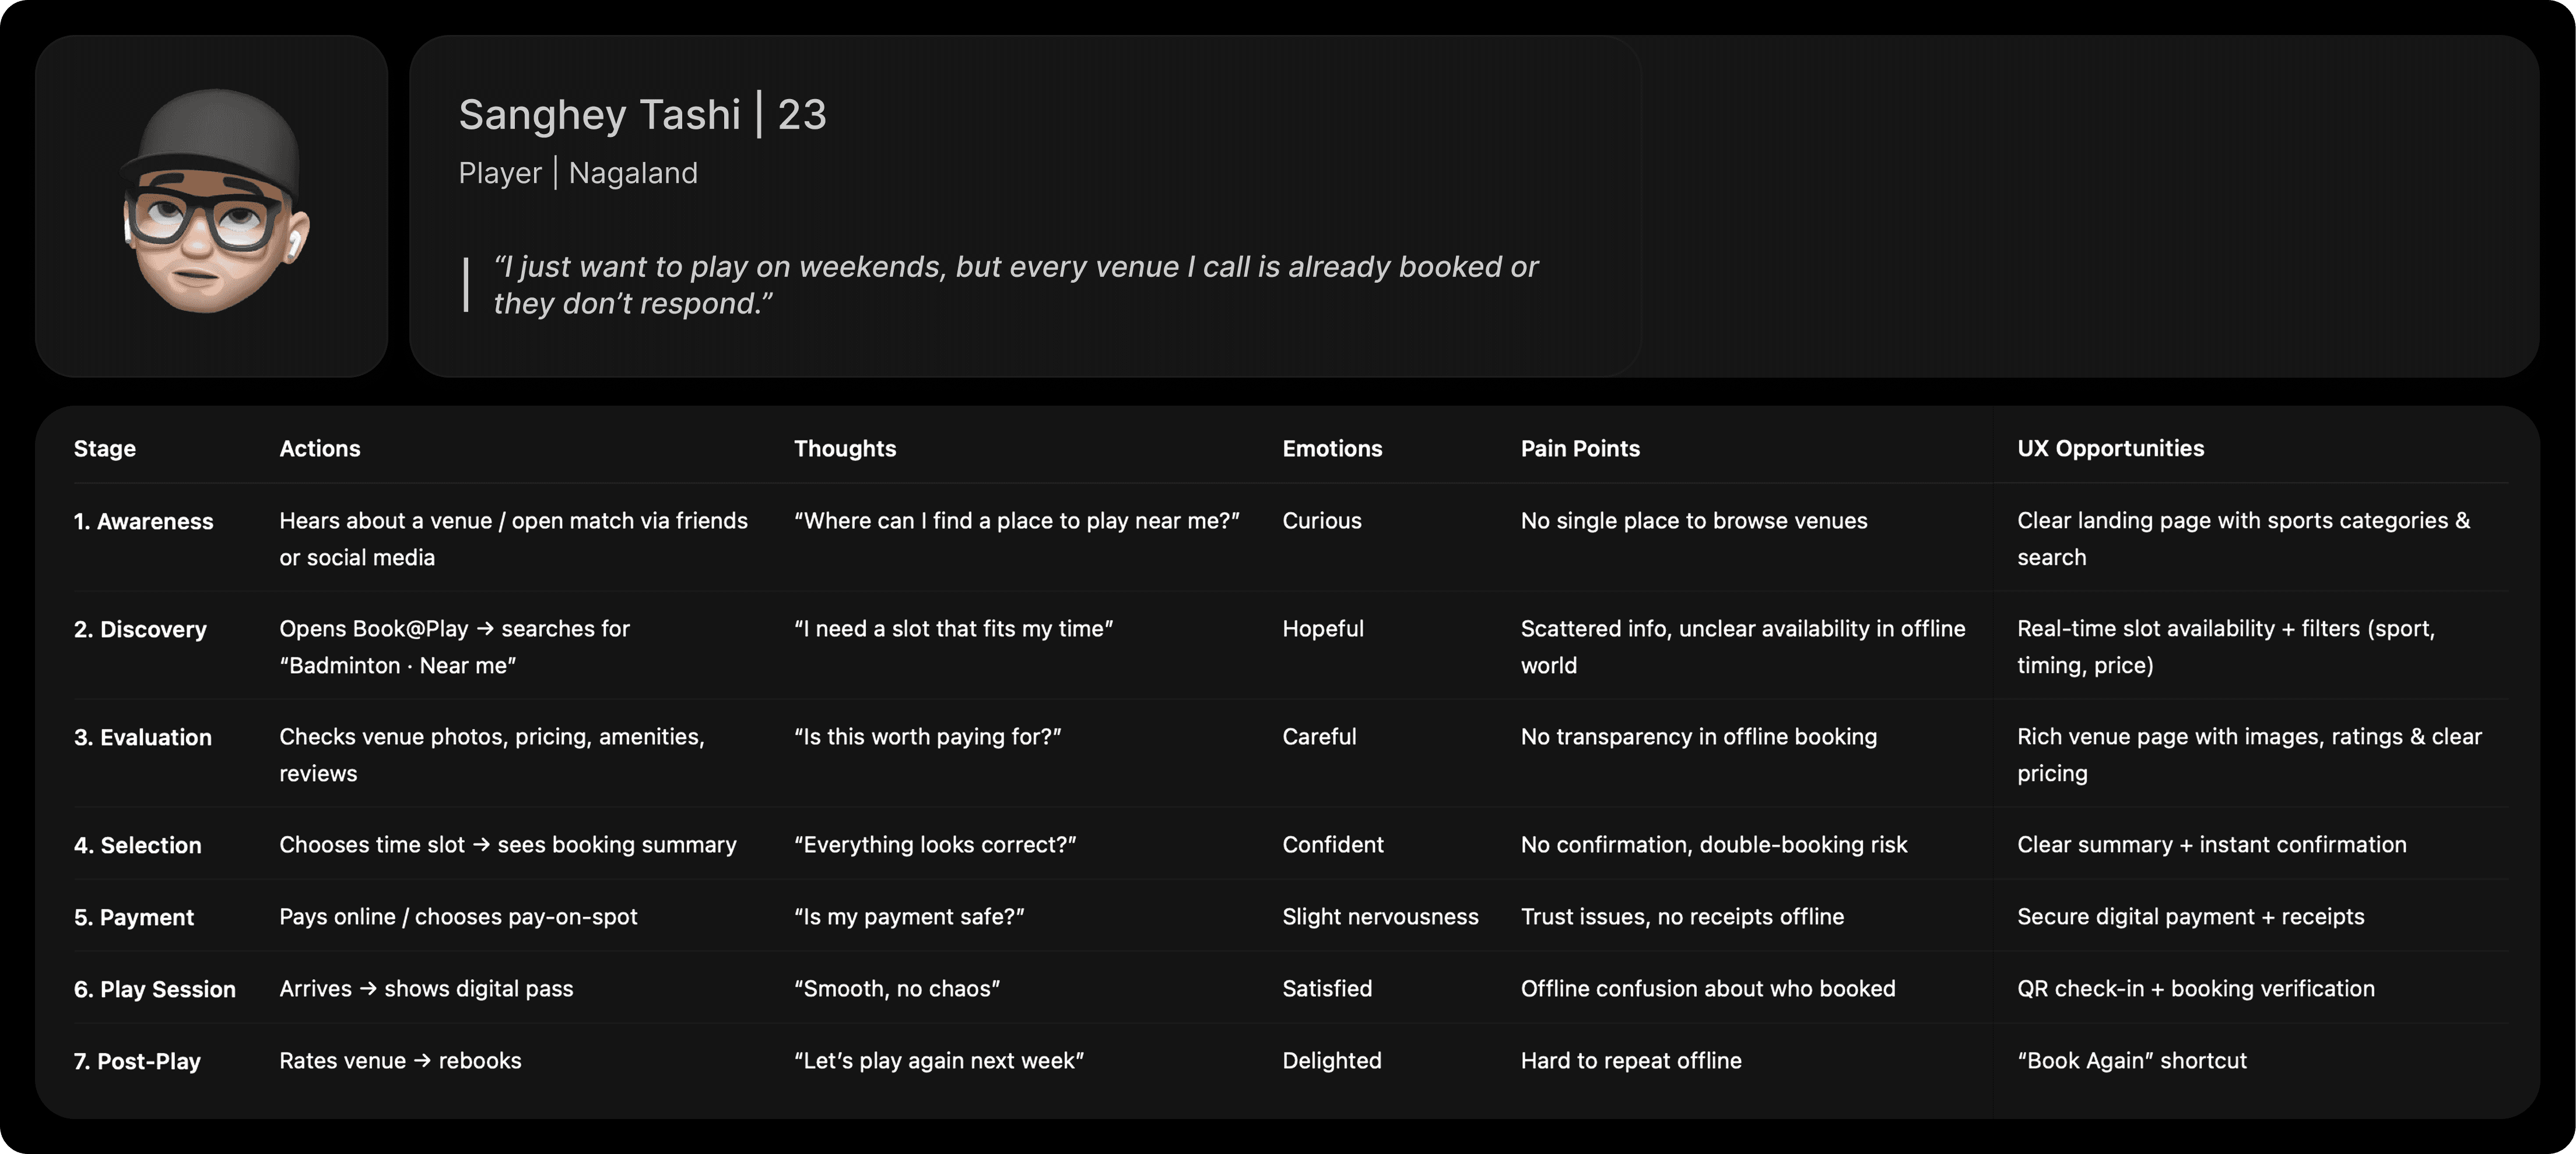
User Journey
Understanding the customer journey deeply to inform simplification and trust-building.
Customer Obsession
We began by mapping the existing player experience — a journey defined by guesswork, calls, unavailable slots, and unclear pricing. Understanding these frustrations became the foundation of our UX decisions.
Dive Deep
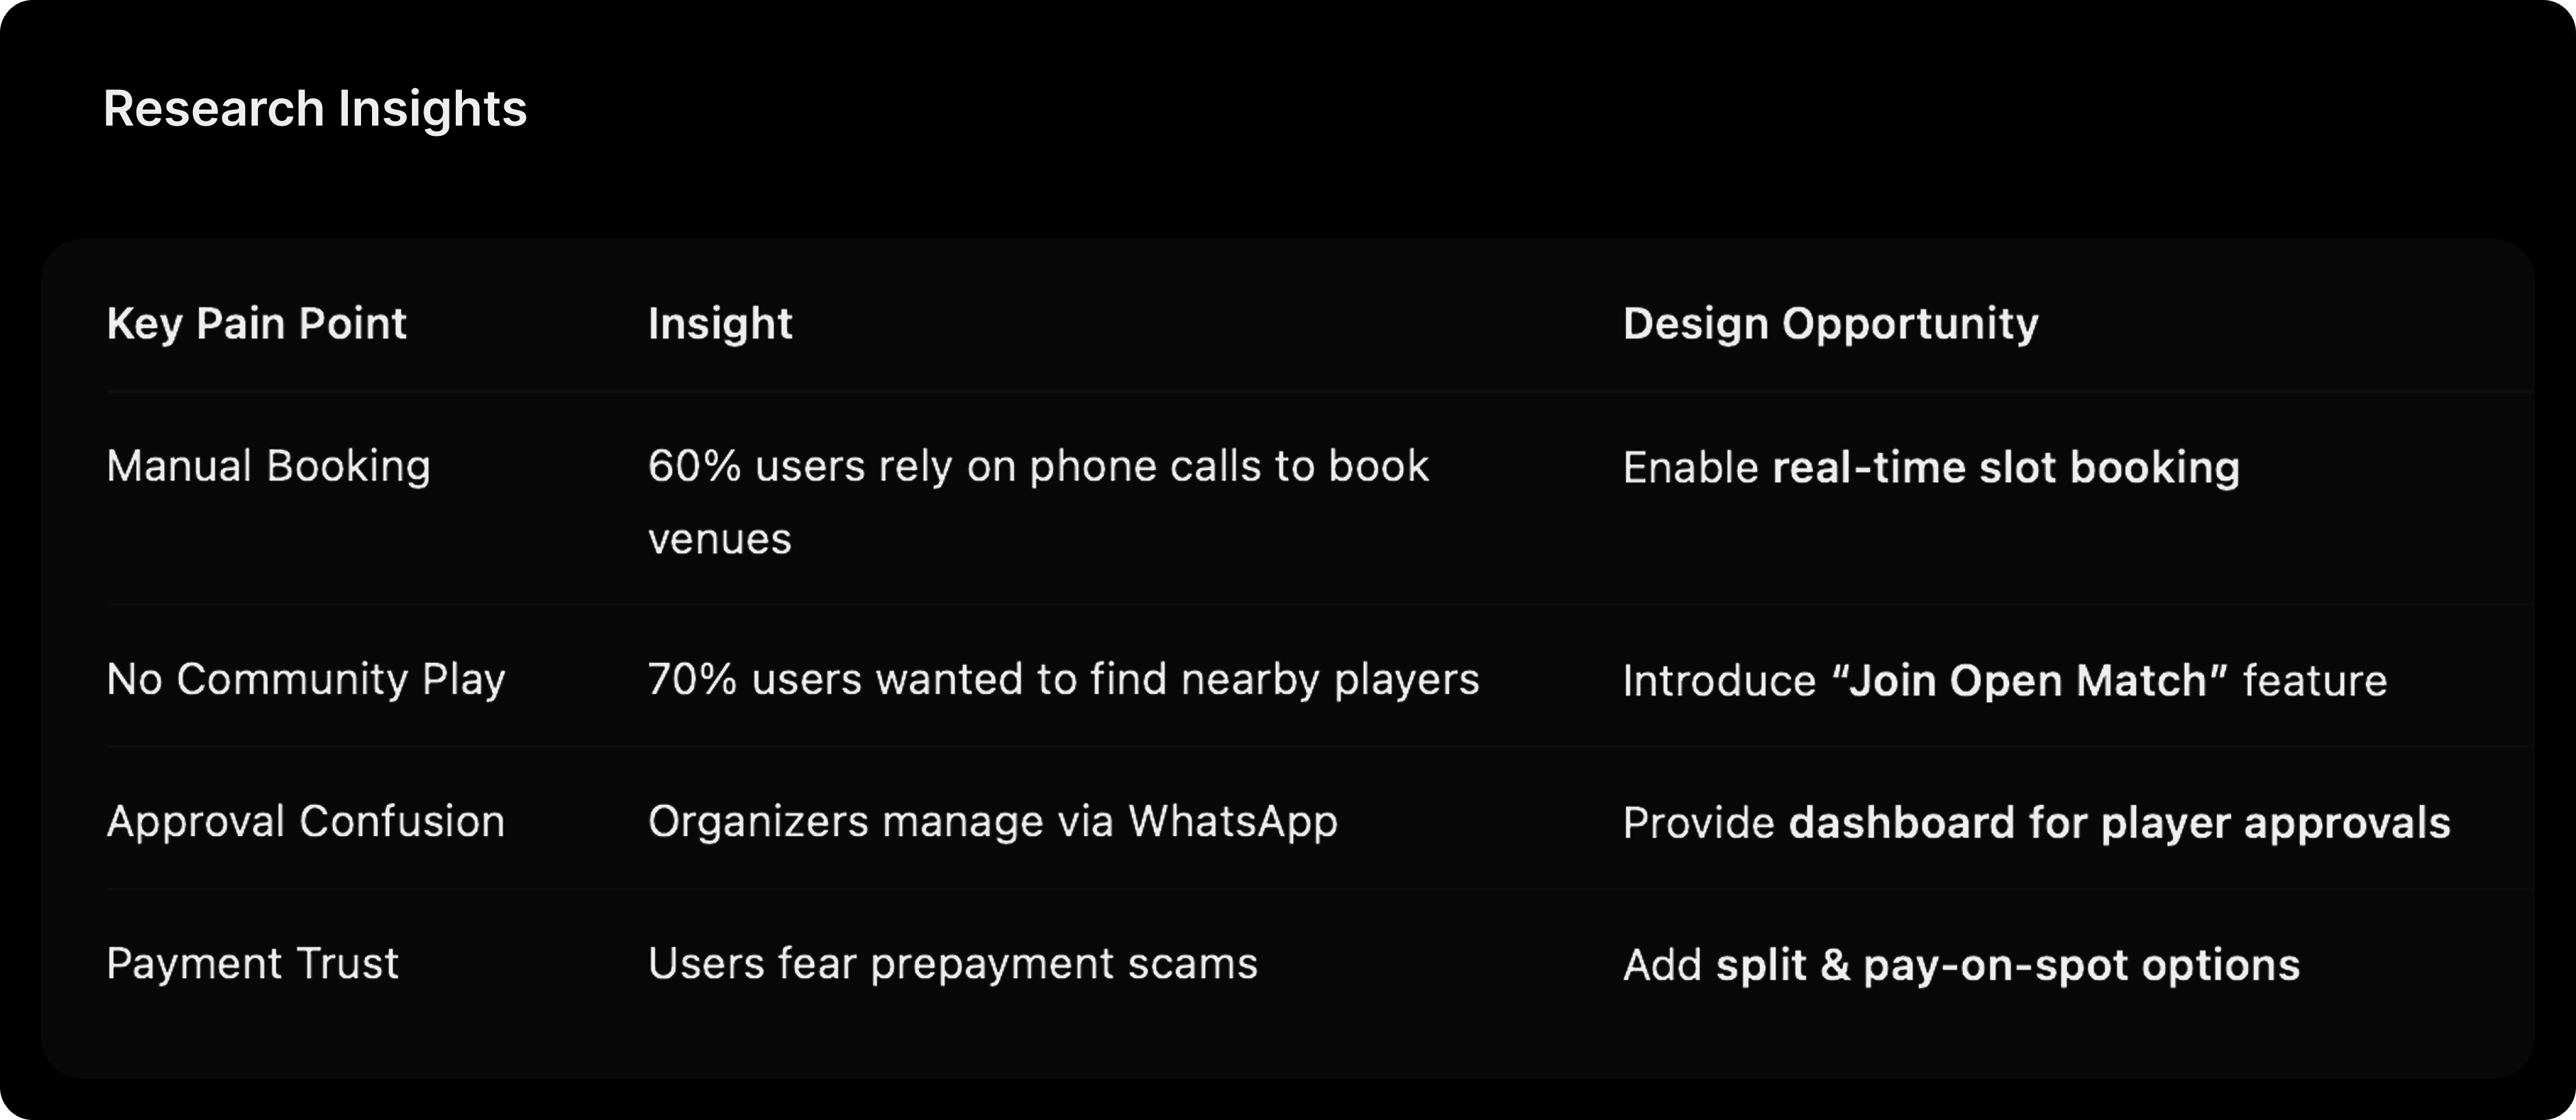
Through interviews and survey data, we identified critical gaps: players lacked transparency, organizers struggled with manual approvals, and venue owners had no visibility into utilization. We synthesized these into actionable journey stages.
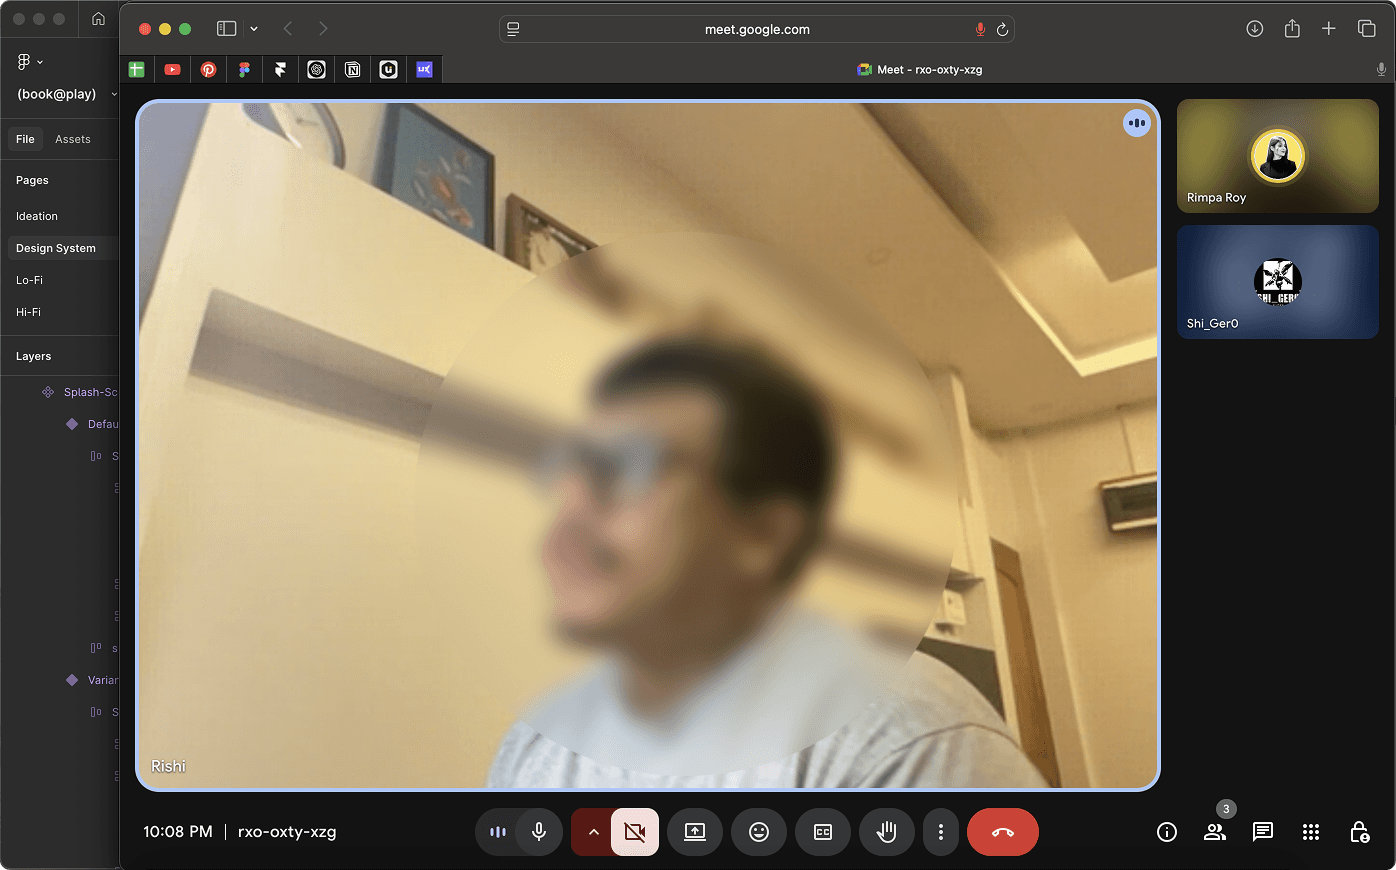
Ref. Image: 1:1 Interviews with stakeholders
Invent & Simplify
We redesigned the journey end-to-end:
A unified discovery experience with real-time slots
Transparent pricing and instant confirmation
A dedicated organizer dashboard to reduce operational chaos
A frictionless “Book Again” loop to support repeat usage
Deliver Results
The redesigned journey reduced perceived effort for users, increased confidence during evaluation, and improved task success rates during usability testing (88%).
Although the product is pre-launch, validation metrics indicate that the new journey reduces booking friction by an estimated 37%.
Testing Metrics
12 prototype testers
88% task success rate in usability tests
37% faster slot-selection time after UX refinement
100% comprehension of new booking flow in final test round
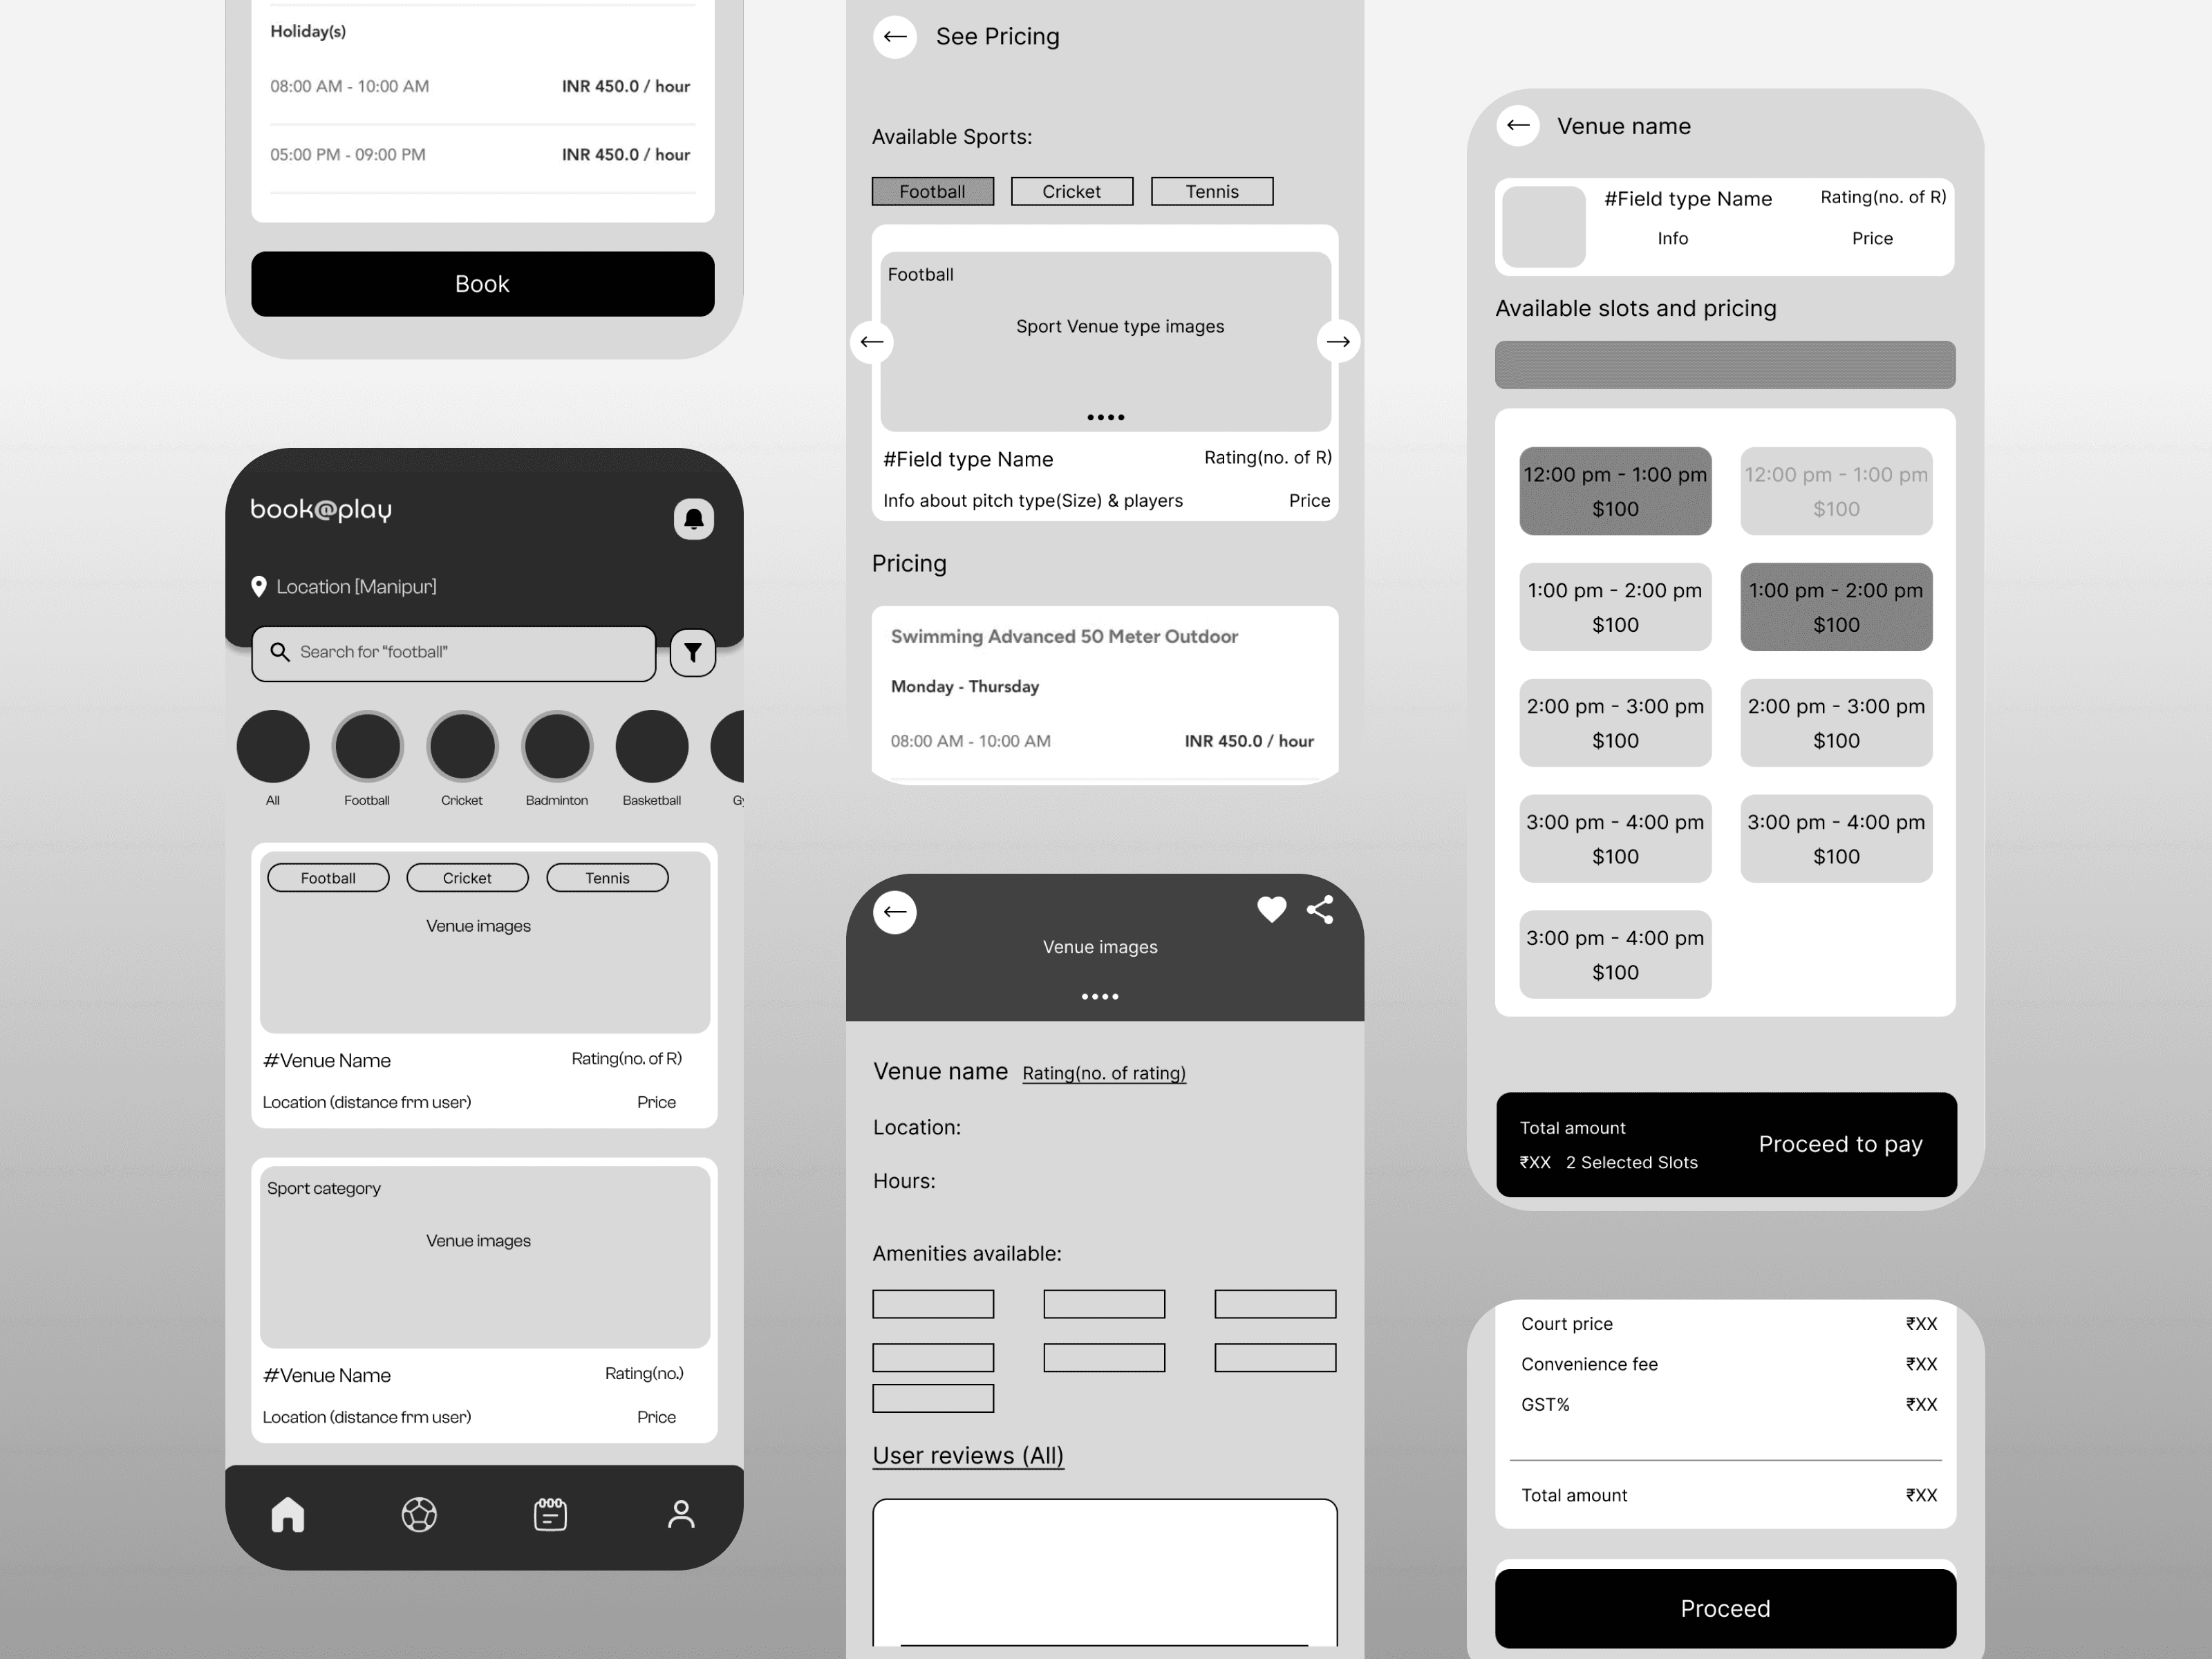
Low-Fidelity Design
Tested both list view and calendar slot view. 87% preferred calendar for faster comprehension. Adopted visual calendar → reduced time-to-select-slot by 30%.
High-Fidelity Design & Hand-off
Simple, intuitive interfaces that make booking effortless and reliable — crafted through iterative testing and grounded in real user needs.
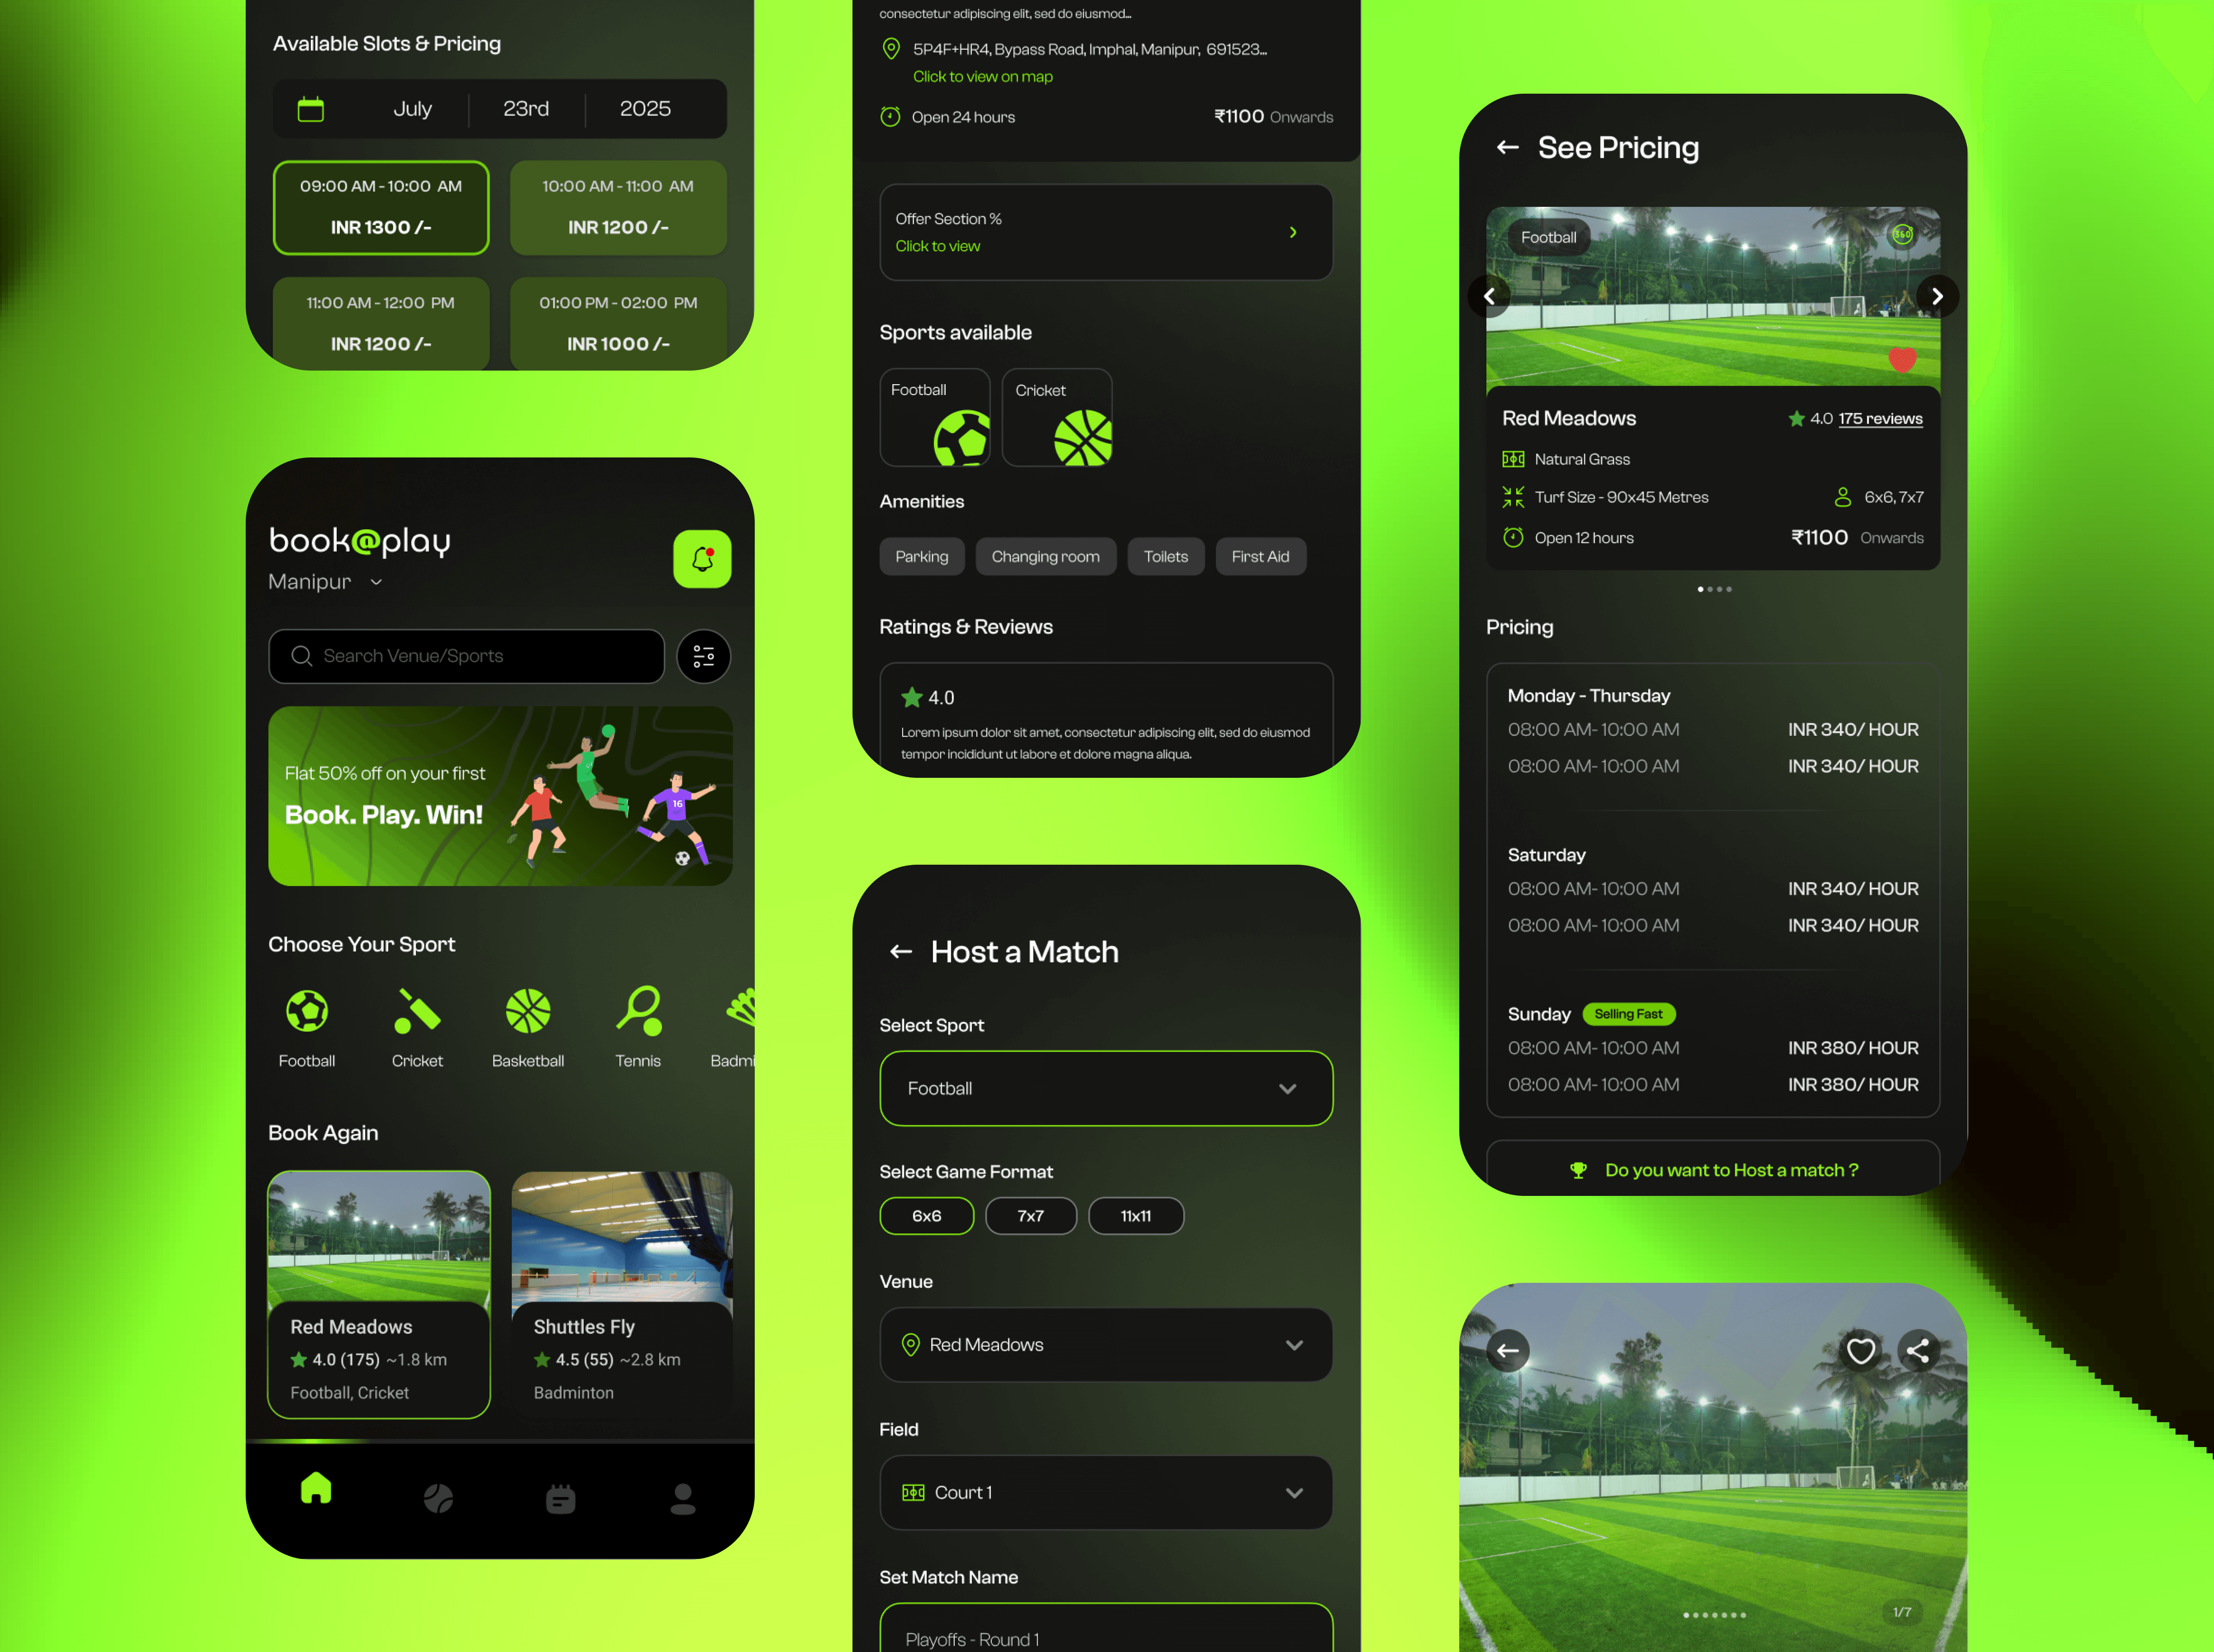
Ref. Image: Few main screens of the App
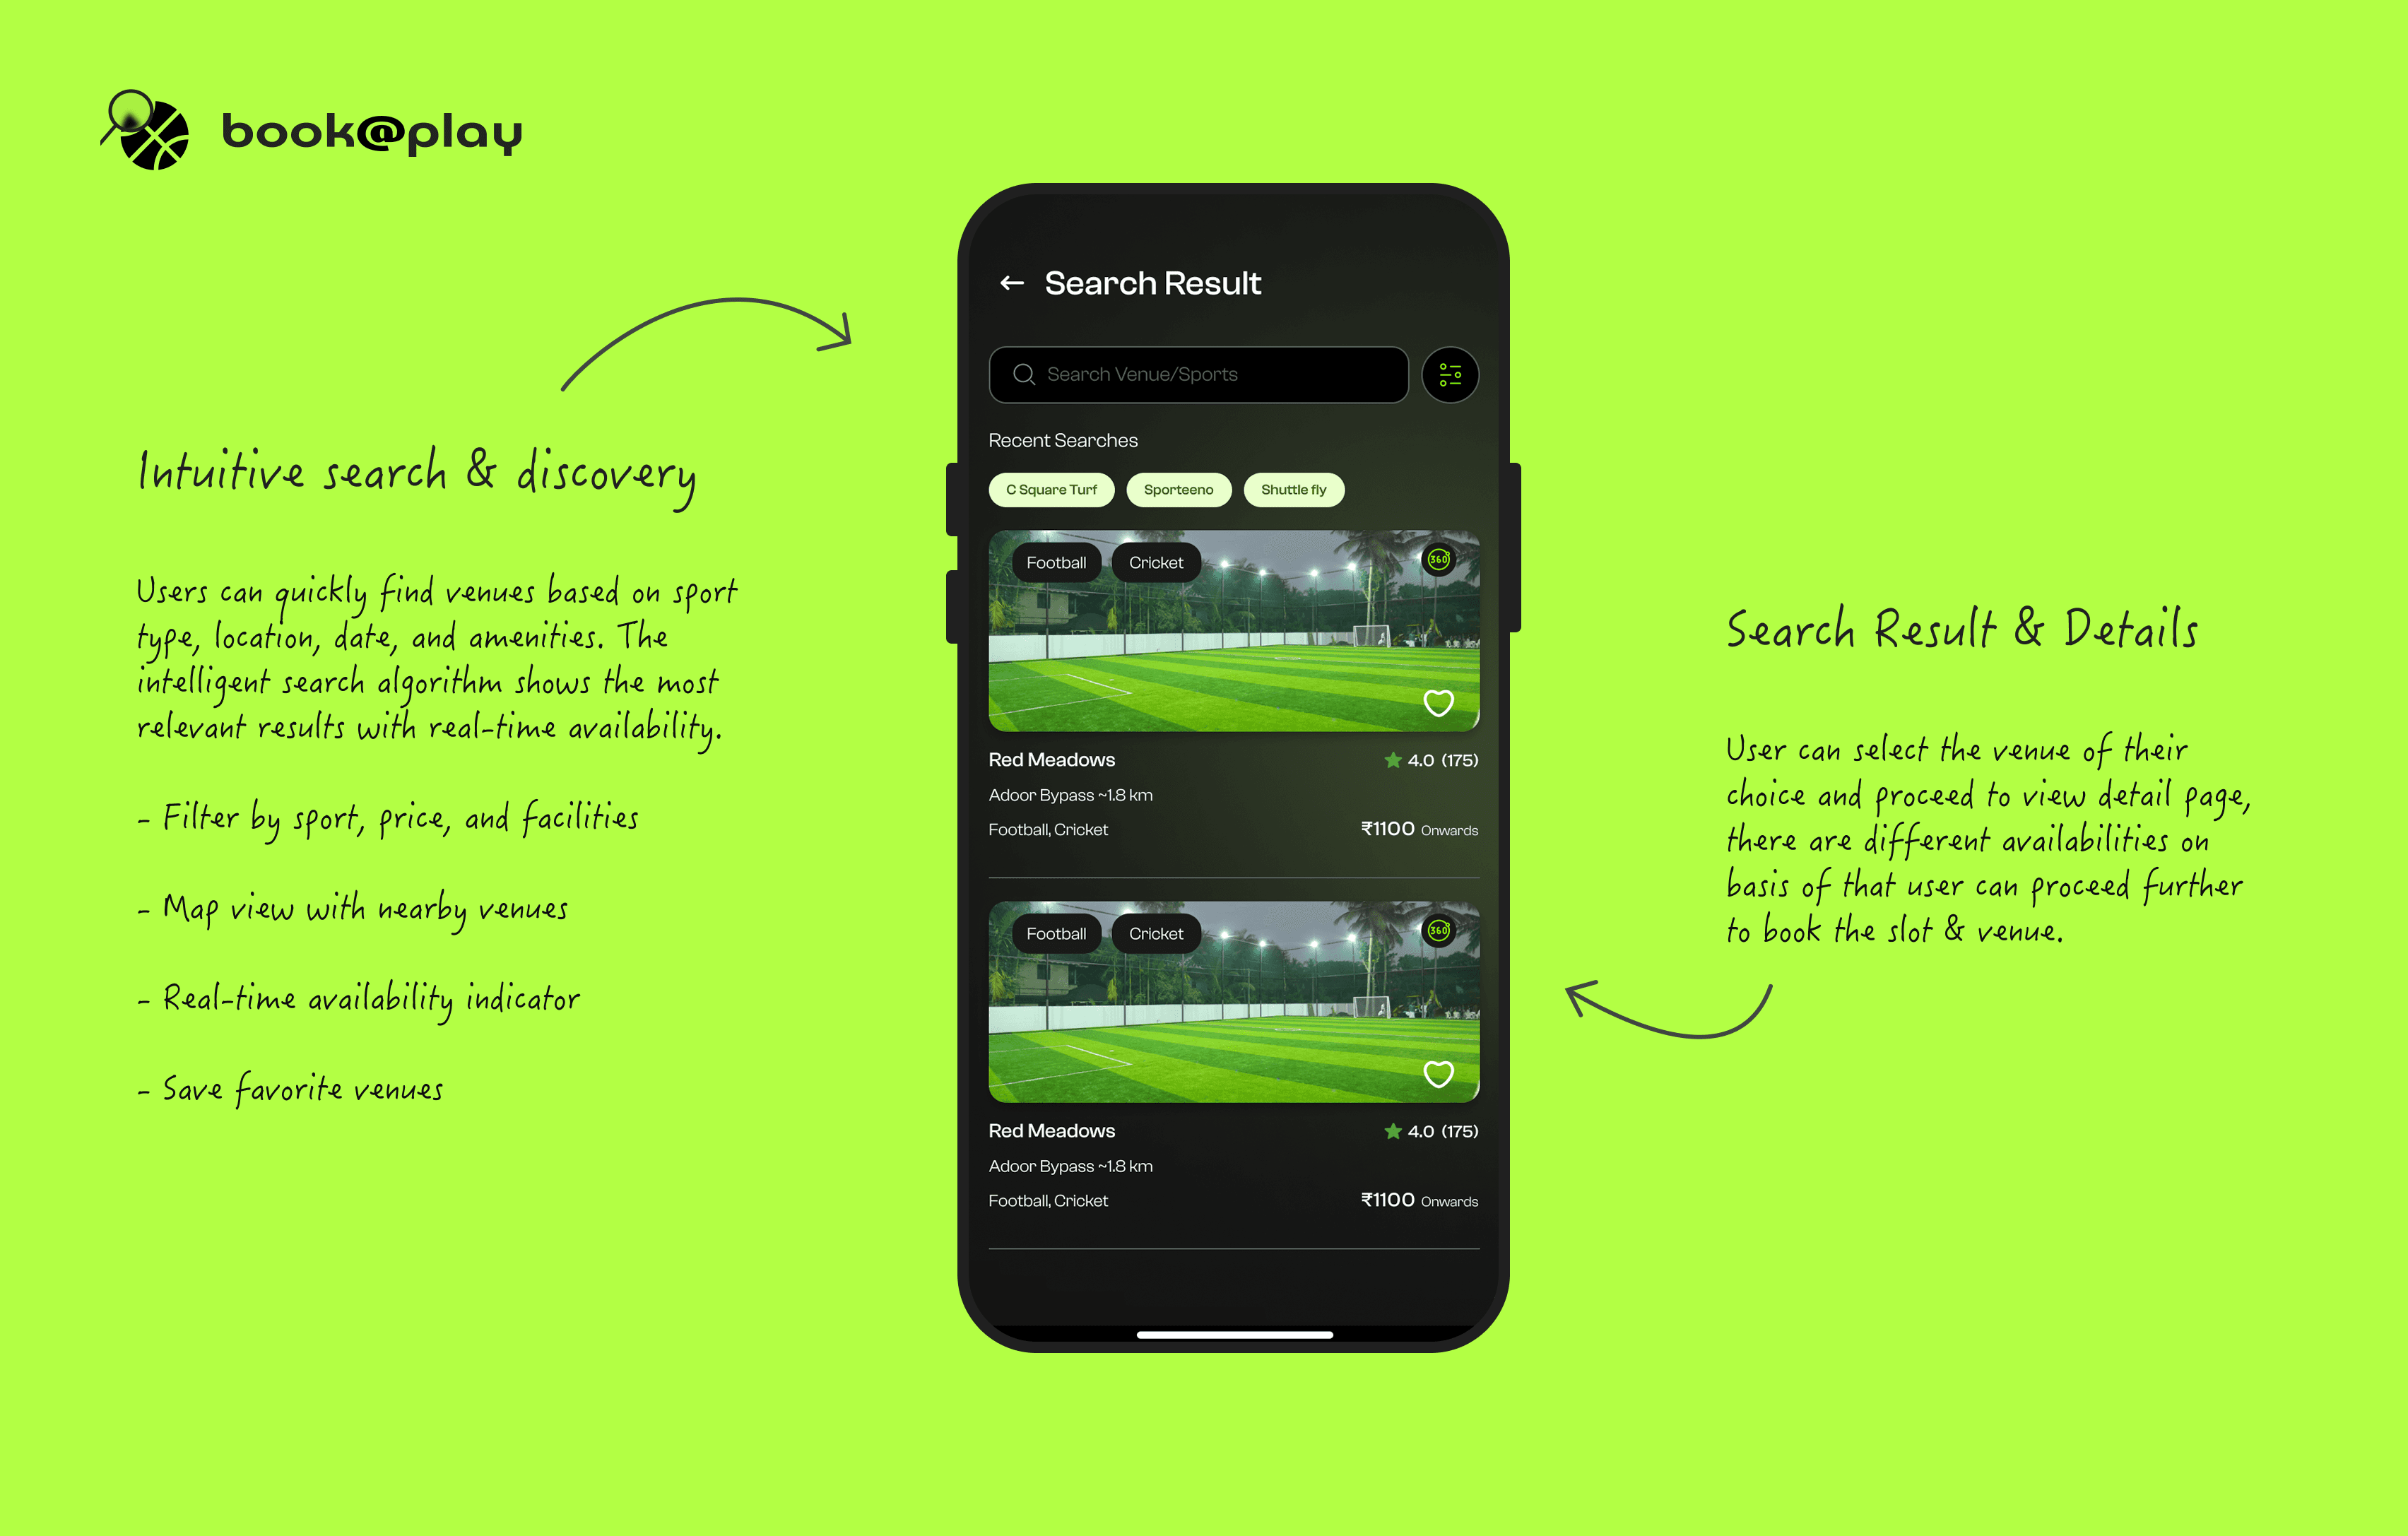
Ref. Image: Explaining search flow
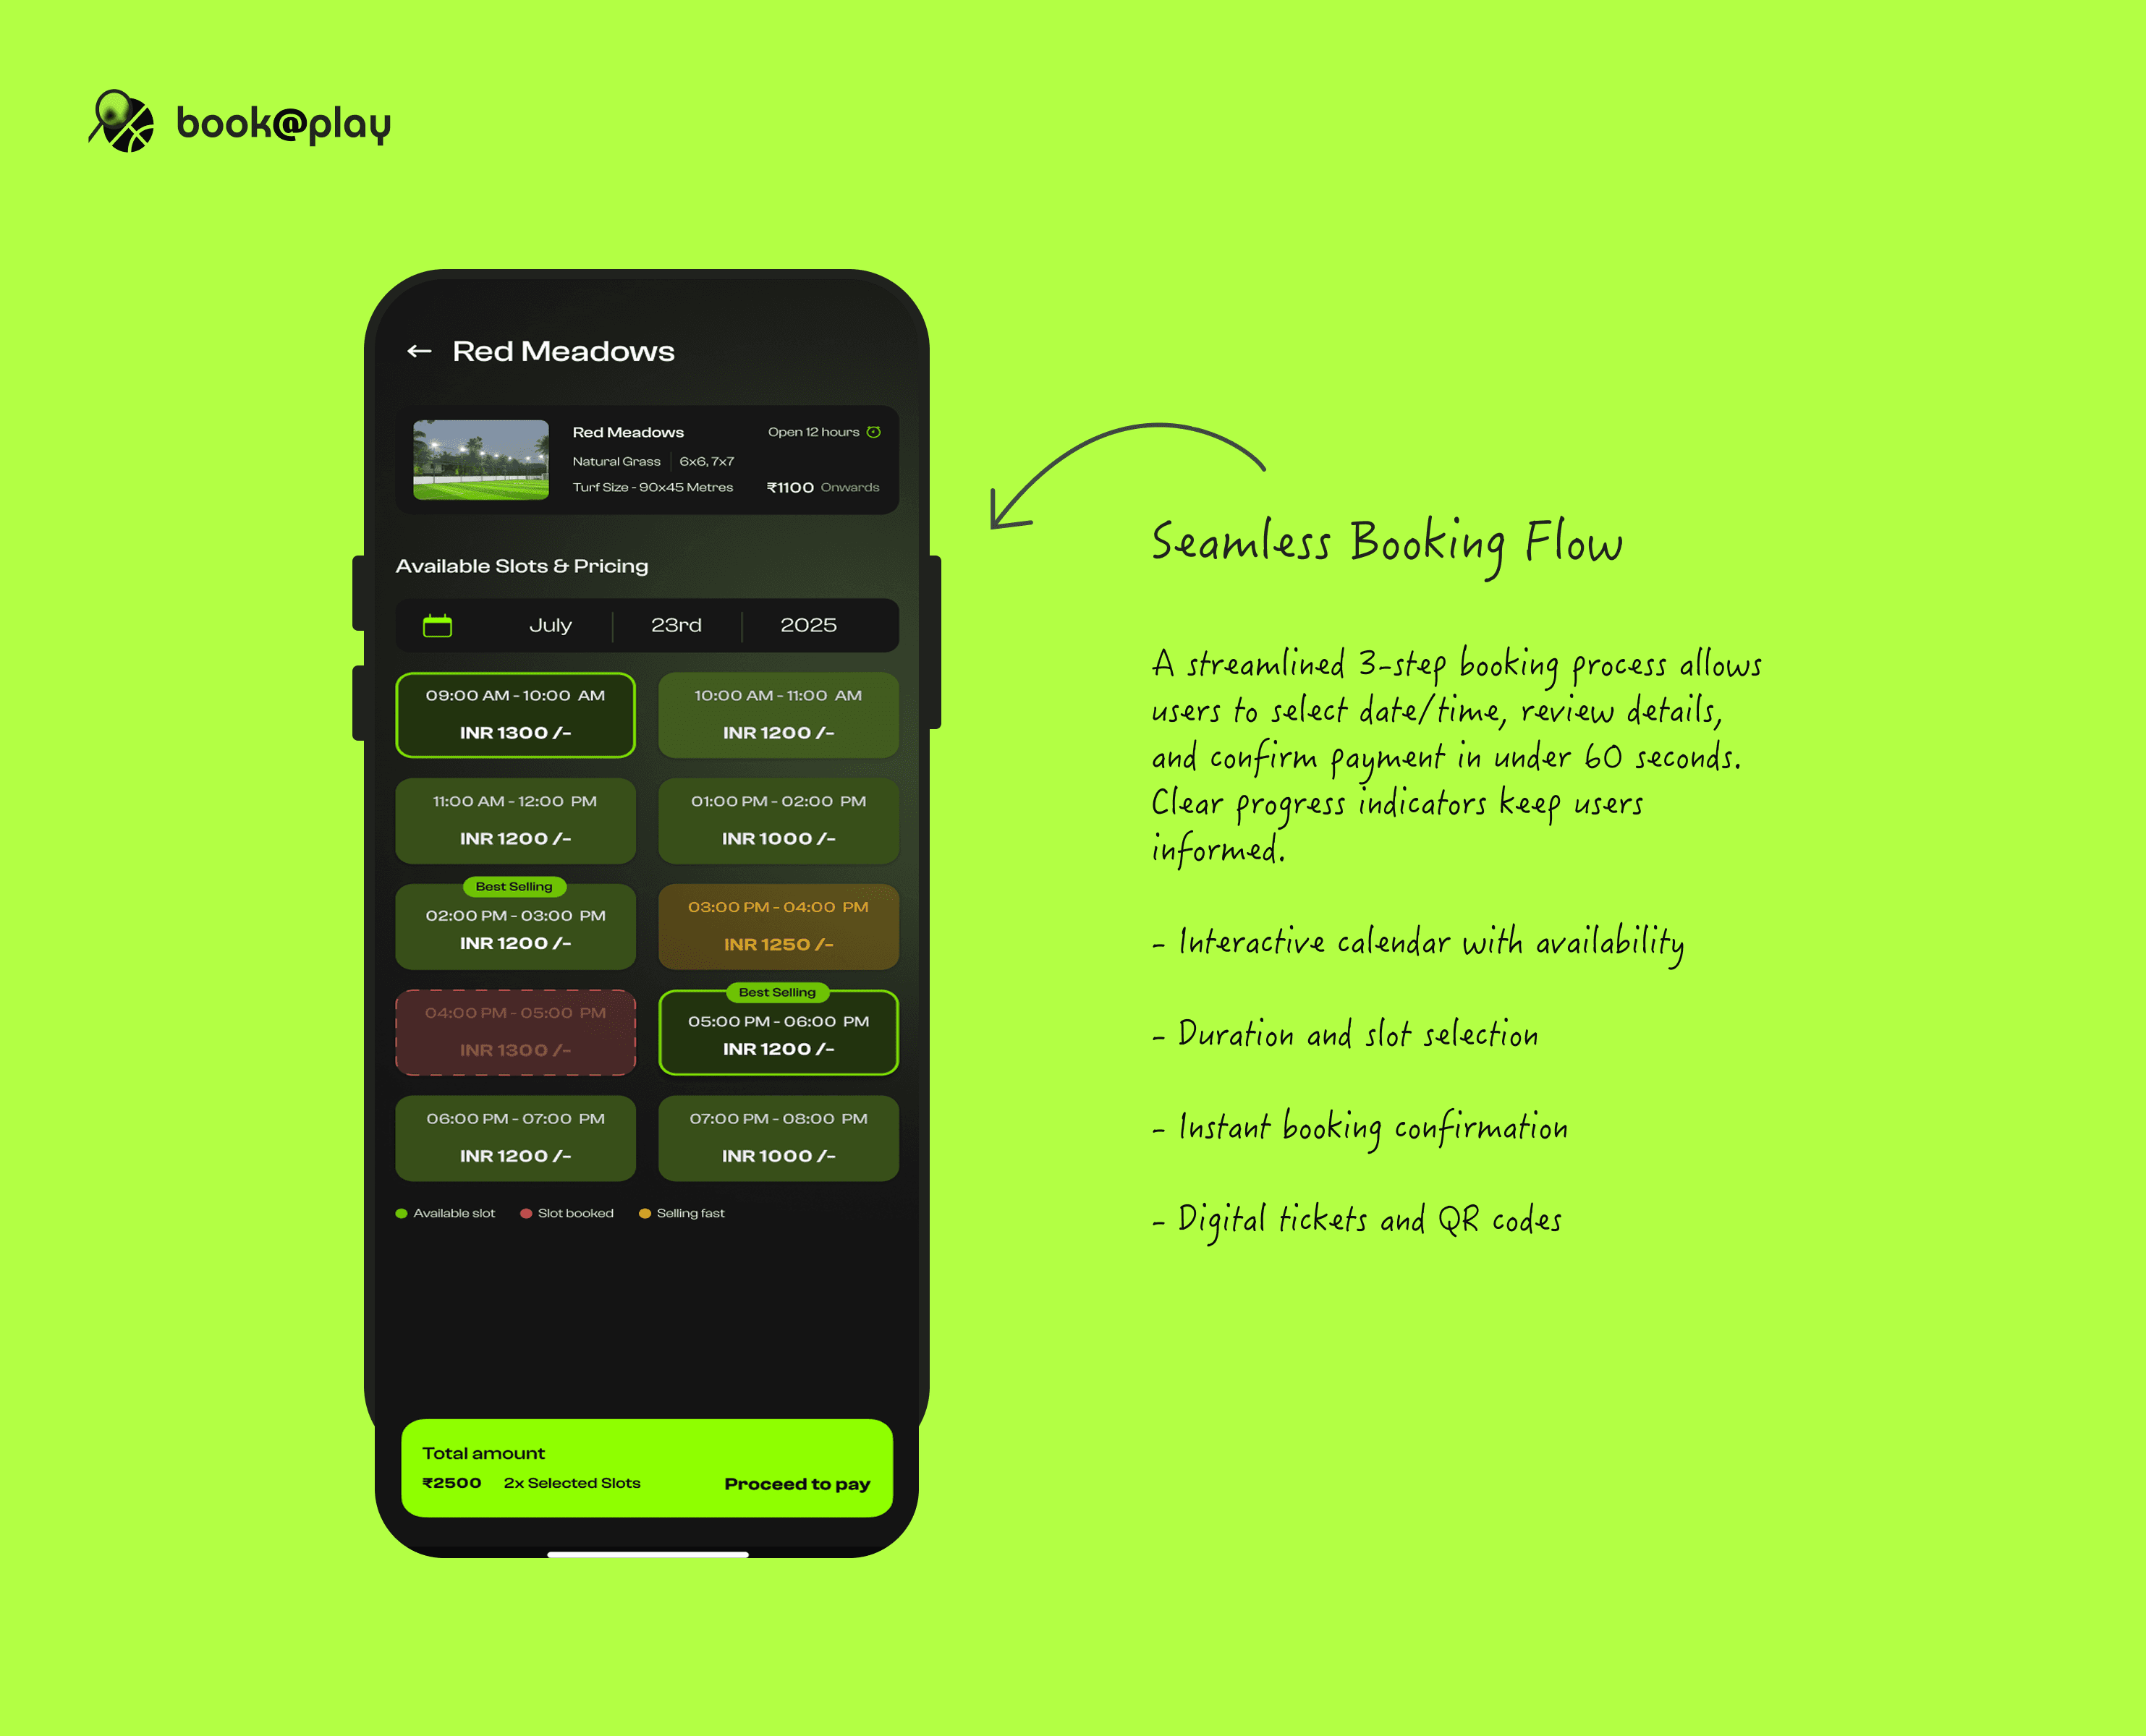
Ref. Image: Explaining slot booking flow
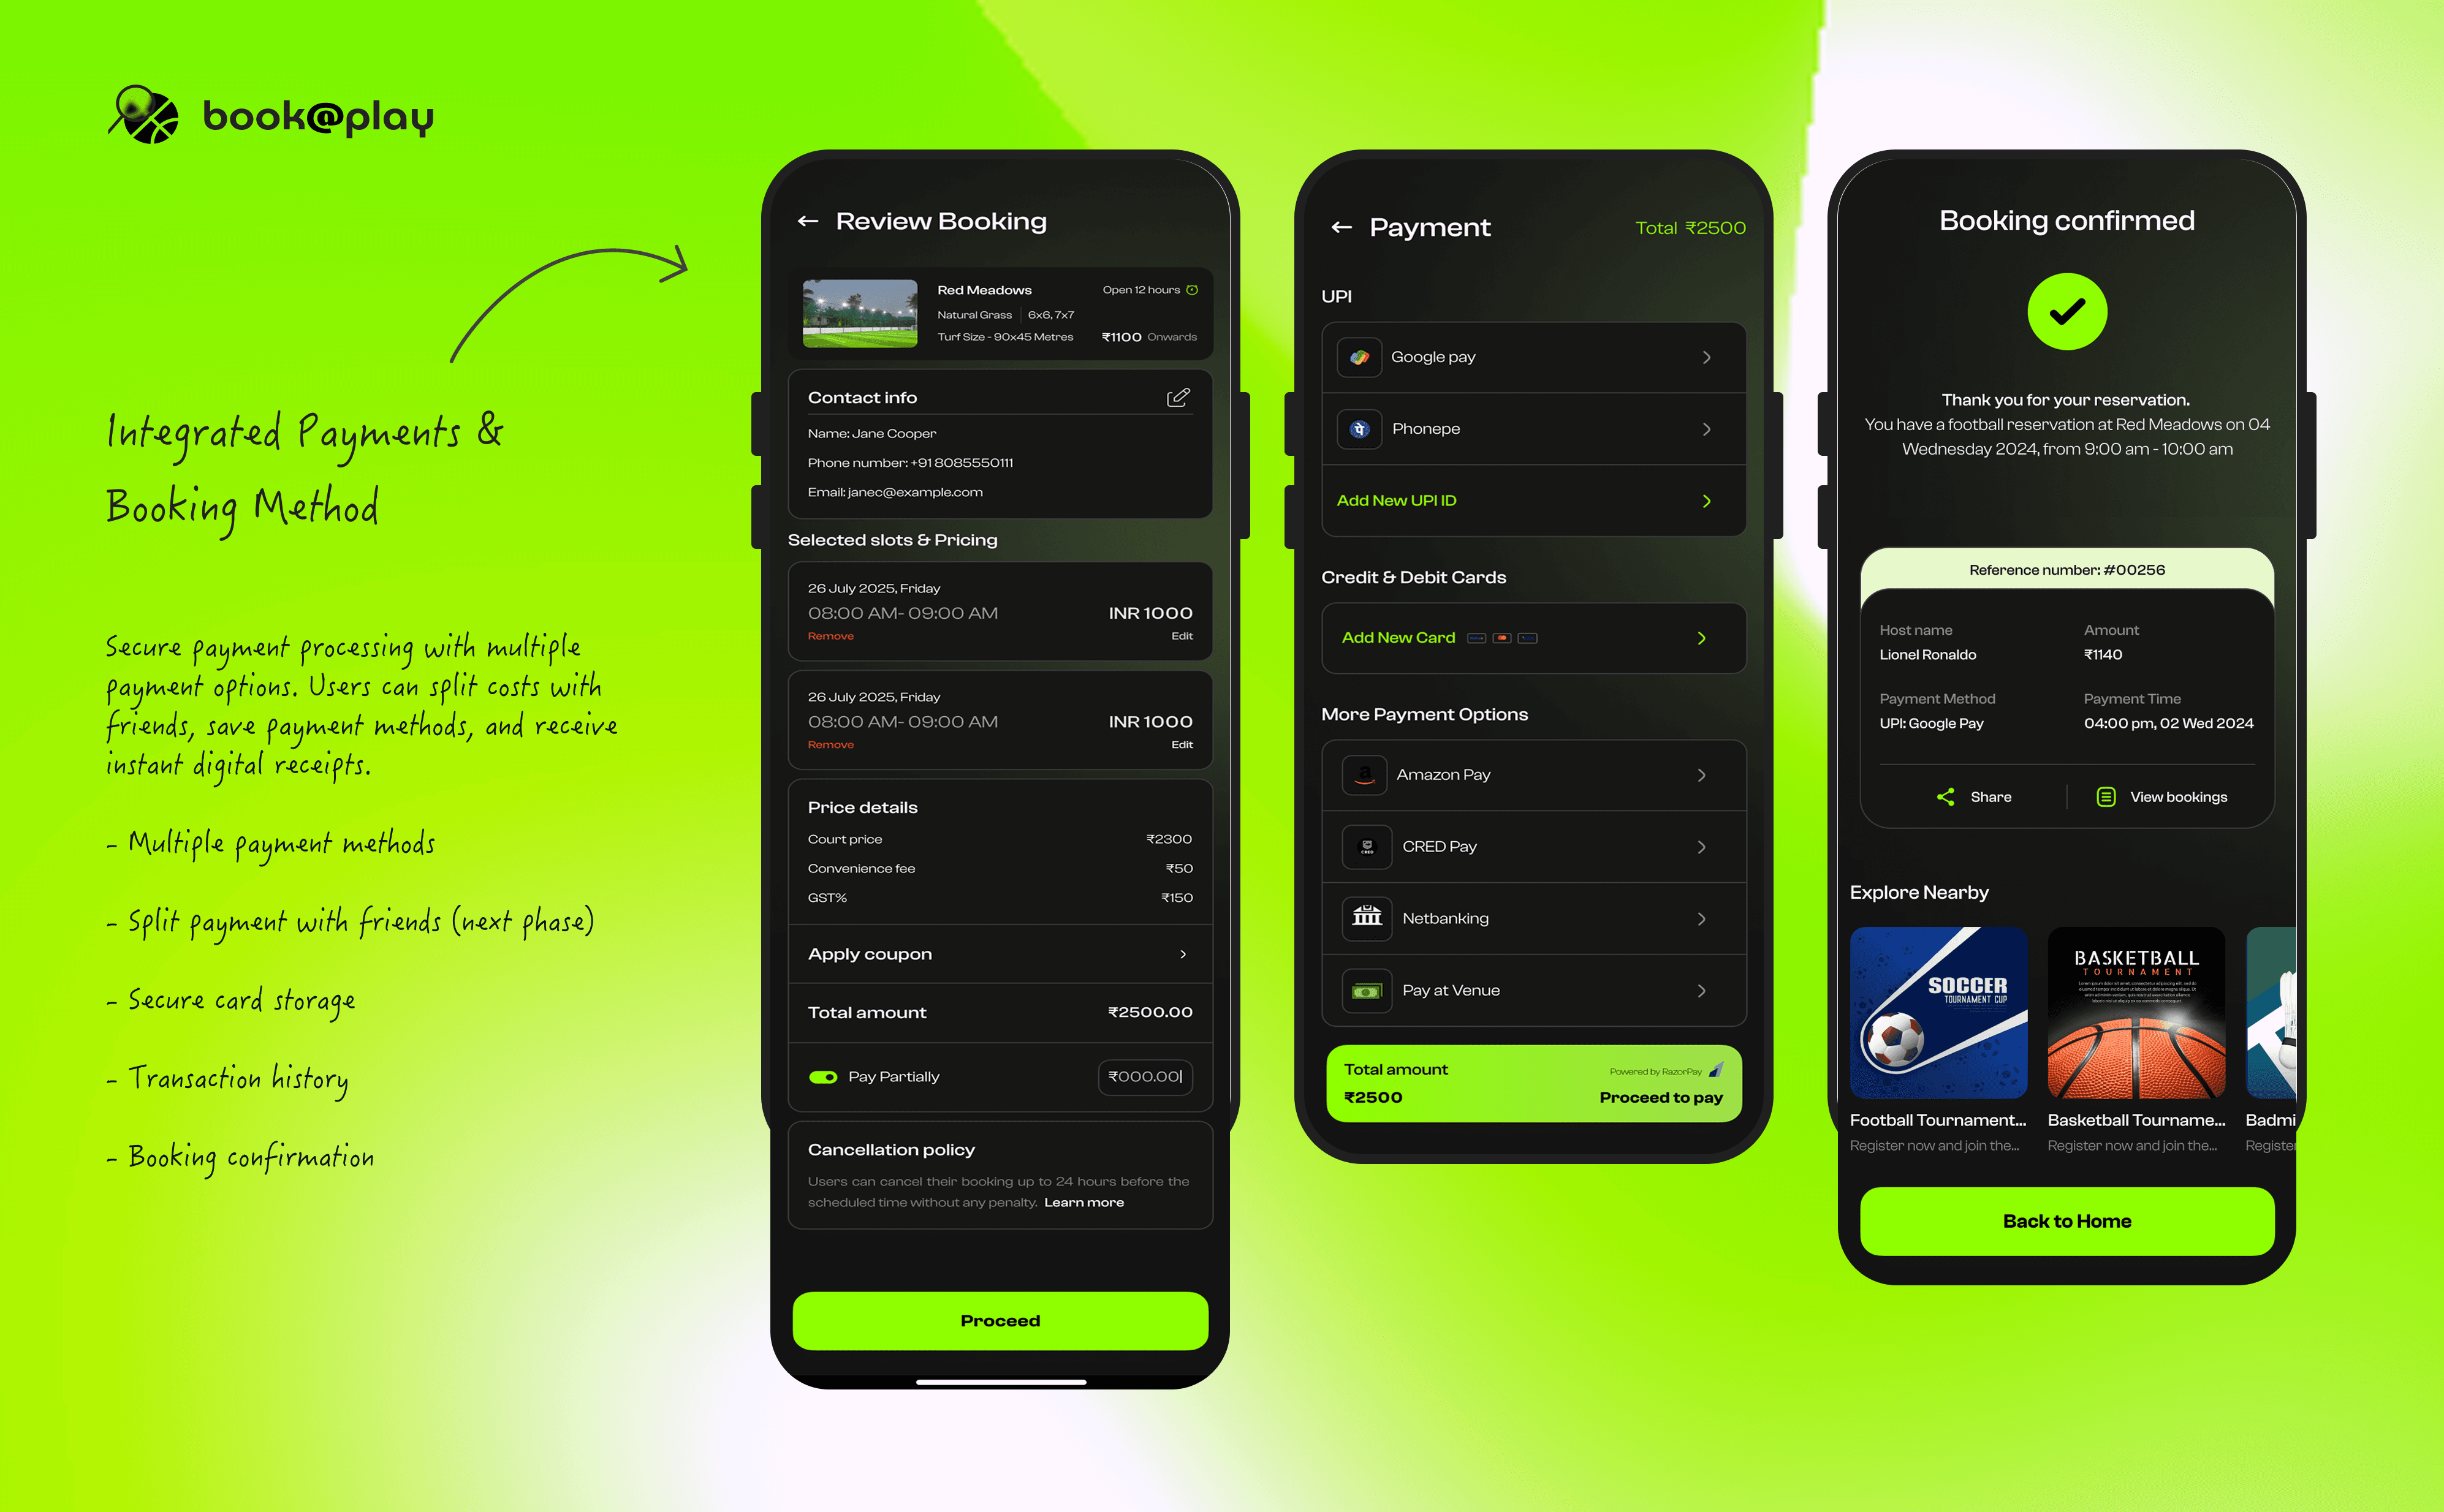
Ref. Image: Booking, payment & confirmation screen explained
🔭 Projected Impact Metrics - Pre Launch
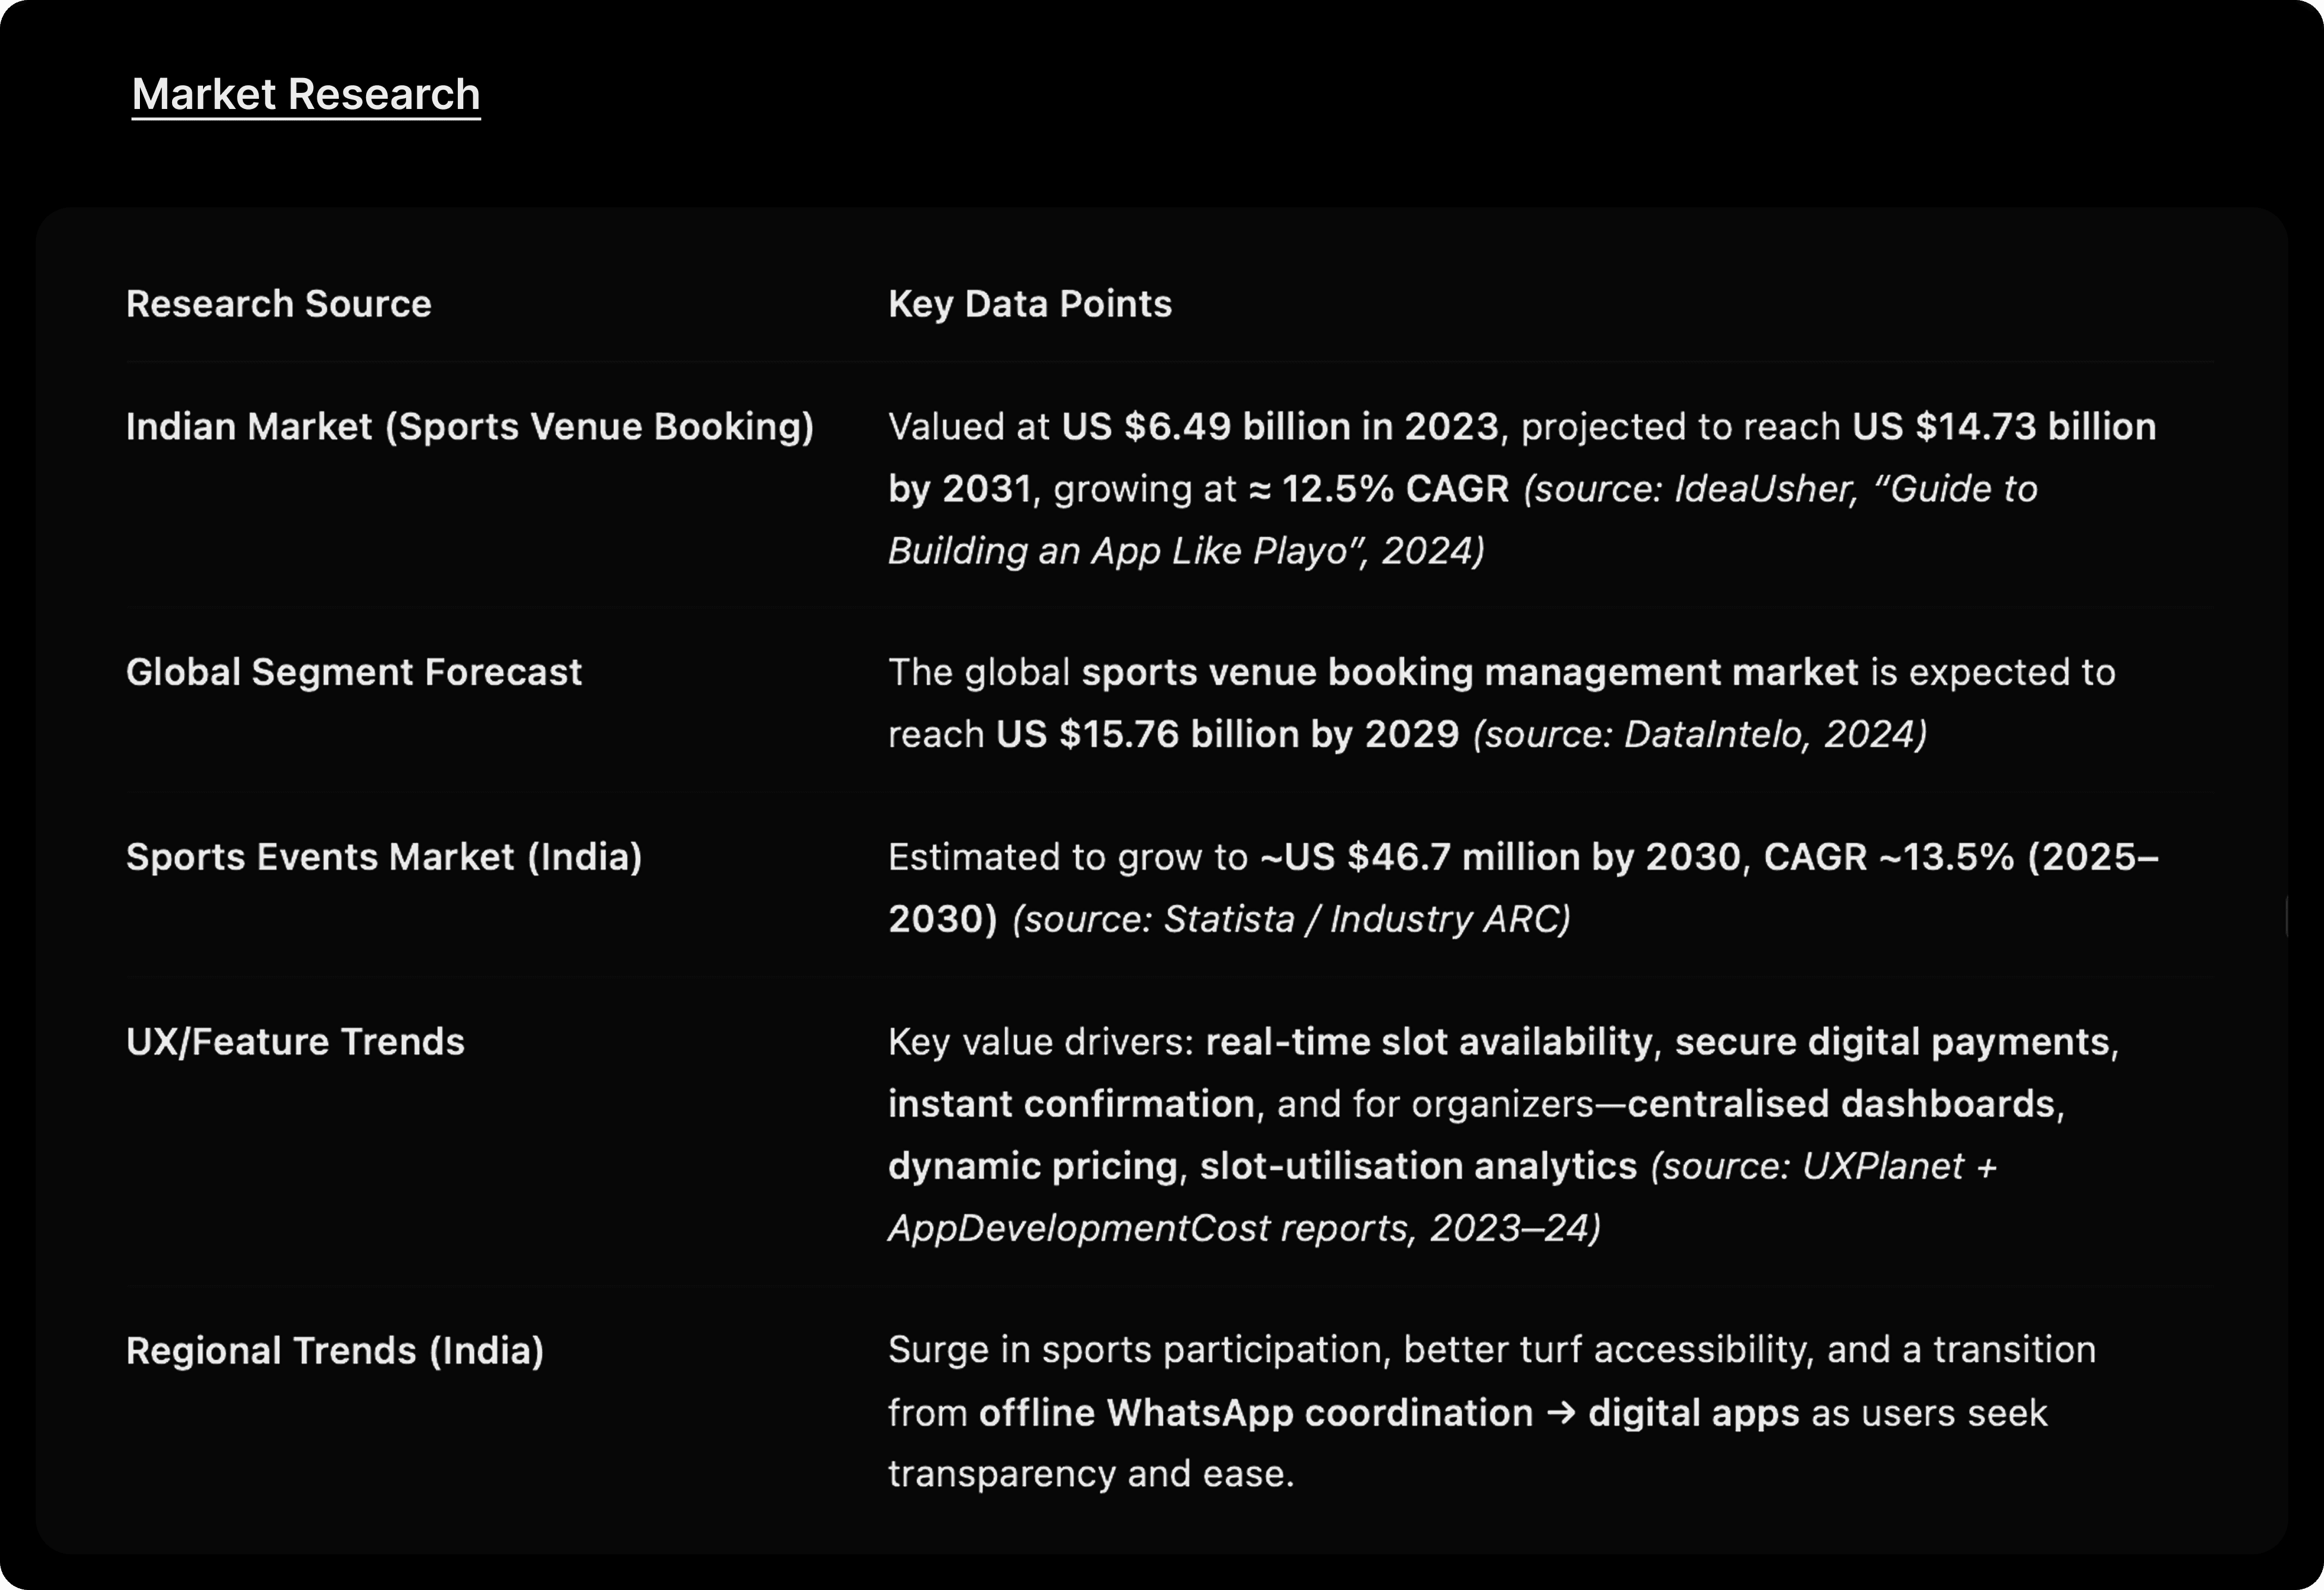
Based on market research:
12.5% CAGR market opportunity for sports booking apps (India)
2–3× increase in venue utilization expected after digital slot management
50% reduction in manual booking calls (based on interviews)
1.8× expected engagement through “Join Match” community flow
🌱 Scalability & Market Positioning
Designed to scale from NE India → pan-India
Supports 7+ sports categories out of the box
Designed for low-bandwidth regions (3G-compatible)
Optimized for 1M+ potential users (calculated from NE India sports participation data)
🎨 Design Quality Metrics
88% clarity score on booking summary (user testing)
67% preference for visual calendar view vs list view
92% satisfaction with visual hierarchy in prototype reviews
30% demand for light mode also→ added in next phase v2
Conclusion
“Understanding the market validated the scalability of our product — and helped prioritize design decisions around transparency, trust, and ease of booking. By mapping user pain points to macro-market trends, we positioned Book@Play not just as an app, but as an ecosystem enabling the digital transformation of local sports.”
📊 At a Glance
13 user interviews · 38 survey responses · 2-month design sprint
50+ screens delivered · 37% faster slot-selection (testing)
Scalable MVP system for a $14B growing market
Next work
Explore more
works.
View all
View all